Spartan Trader - part 7 (H19)
Charting Financial Data
Goal
By completing this homework you will learn to chart financial data stored in a remote database.
Context
"Have you met, Mr. Bond, Stockton Bond?"
"No, Ms. Tickertracker, who is he?"
"He is our DAZZLING director of trading. We chatted about what makes an EXTRAORDINARY trader and he told me that his best traders
not only understand the financial models and the underlying economics, but are also very good at reading charts."
"That makes sense. A chart is a great tool to pick up trends and patterns."
"Your reasoning is IMPECCABLE! Stockton recommends that the Spartan Trader produce real-time charts of the securities in our
universe. Can you add that functionality to the Spartan Trader?"
"Of course. I am on it, Boss."
Requirements
This homework adds to your Spartan Trader the capability to chart financial data. Remember though that we cannot guarantee that even solutions that earned 100/100 are in fact 100% correct. The new installment:
- Fulfills all previous requirements
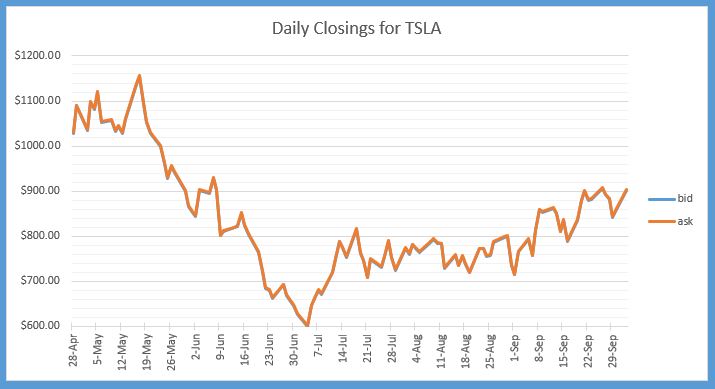
- Creates charts of the bid and ask prices of the stocks and options included in the Tournament. Colors and shapes are up to you, but they must be easy to read. Remember that you will need them to participate in the tournament.
- Visualizes your team ID. Change it in the Global variables and make sure there is no more team "30" in yoor program.
For reference, this data model shows the structure of the three databases. The vLab contains a demo and instructions and this file contains some code, so that you do not have to type as much. As before, feel free to change the look and feel of the app.
Bug Fix:
In the DownloadLastTransactionDate function you need to replace "Return startDate" with "Return GetStartDate()"