Data cleaning/wrangling with MS Power Query
(graded individual assignment #7)

GOAL: Learning how to clean data with a widely available, modern tool.
TASK: This is a pledged individual assignment. Work on your own.
1. Watch the first 37 minutes of this video. Alternatively, if you prefer reading to watching, this is a good source.
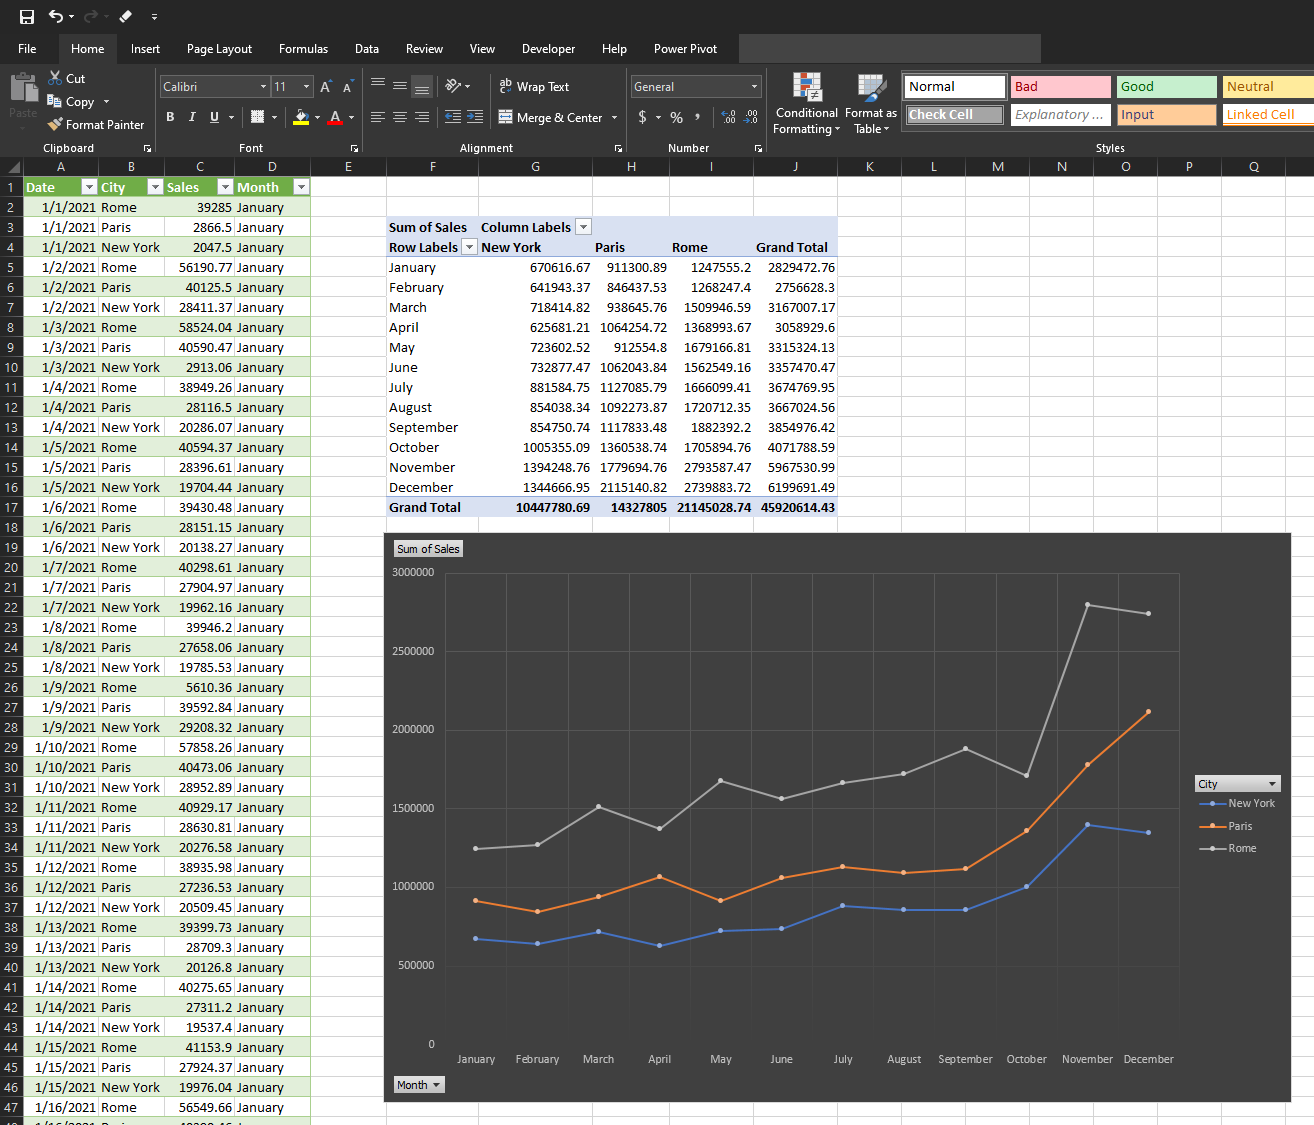
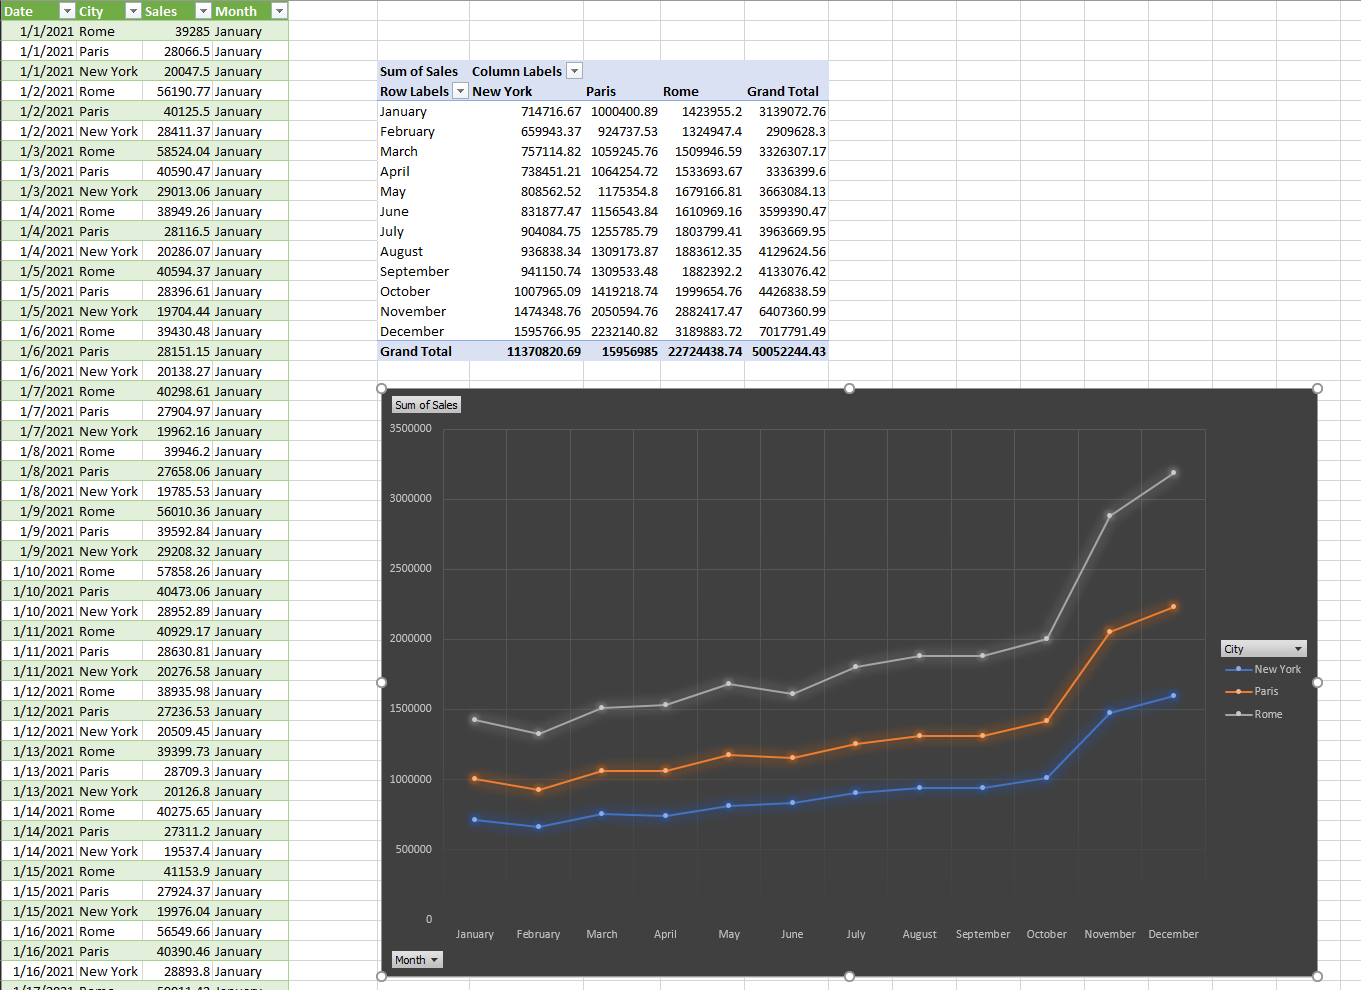
2. Fully clean this dataset which describes sales from three luxury goods stores at three major city airports. You must use Power Query (not Excel) to clean the data.
3. Add a column with the name of the month (see figure). Hint: Duplicate the date column, make sure it is the right datatype, and then transform it. It might take some time to find the function, but it is there.
4. Close and load.
5. In Excel, create a pivot chart similar to the one in figure below. The chart must show monthly trends for the three stores over the course of one year. Trends are shown as lines. It is OK if the chart style and colors are slightly different than the pic, and if there are minor rounding errors.
4. Post the Excel spreadsheet in your box. Name it DataCleaning.xlsx
CRITERIA: Data must be fully cleaned, the pivot chart must show what is asked, and it must work.
Tips for success
The hard part of the exercise is to figure out how MS Power Query works and what commands to use to clean the data. Do not expect
instructions on the specific commands or command sequences. Figuring that out is the exercise.
And this is the earlier erroneous version that still gets full points. (see the Teams message).